Normal Isn't Optimal: Why Your Annual Health Checkup Is Failing You
Written By
Suresh Veerapaneni
Founder & CEO, Healthvizor
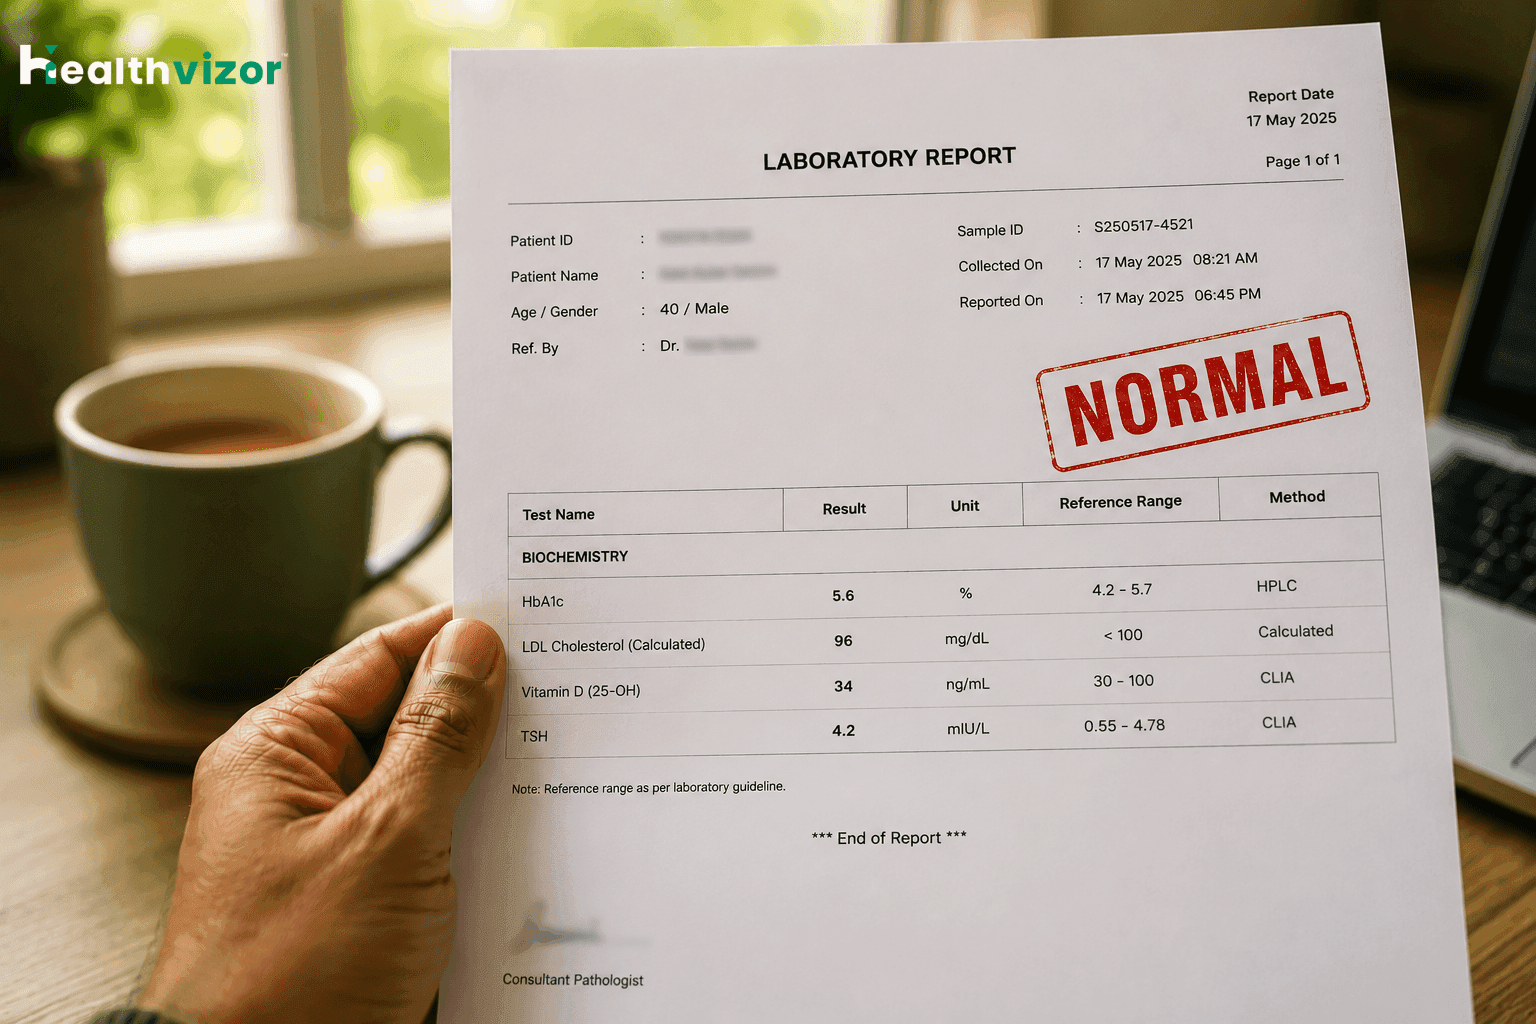
You did the annual checkup. Fasted overnight. Got the blood drawn. A few days later the report arrives, every line ticked off as "within normal limits." And yet, the energy isn't there. The recovery is slow. The brain fog hasn't lifted. The waistband isn't moving.
If that's you, you're not imagining it. The problem isn't your body. It's how the word normal is used in Indian healthcare.
What "Normal" actually means on a lab report
When a laboratory prints "reference range" on your report, it's almost never an optimal range. It's a statistical range, usually the central 95% of values from a reference population the lab tested. Half the people in that reference group are above the median; half are below. As long as you fall inside that bell curve, the report says normal.
That sounds reasonable until you realise the reference population often includes people who are overweight, sedentary, vitamin D deficient, pre-diabetic, or chronically inflamed. In other words, the bar for "normal" is set by an unhealthy baseline, and clearing that bar tells you almost nothing about whether your body is actually working well.
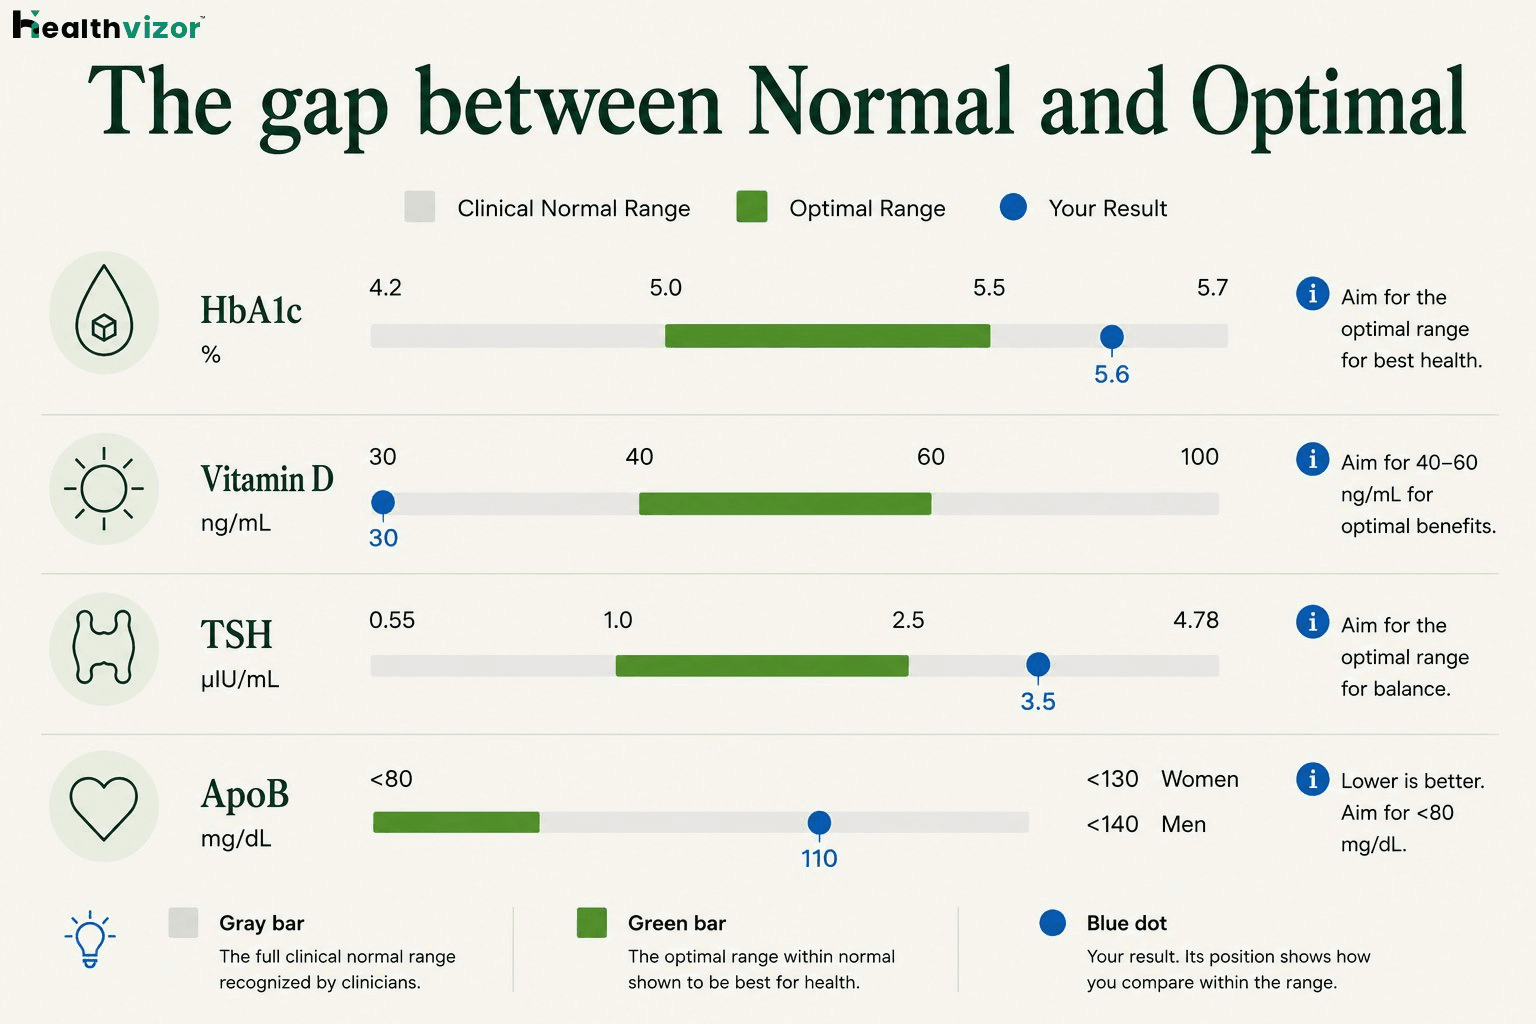
There's a separate, narrower band, what longevity-focused medicine calls optimal, where biomarkers correspond to the lowest long-term risk of disease and the best day-to-day function. Most annual reports don't even mention that band exists.
1. HbA1c: damage starts before diabetes
Pull up the interpretation printed on your own HbA1c report and you’ll usually see the American Diabetes Association’s three bands: anything under 5.7% is labelled “Non diabetic,” 5.7–6.4% is “At Risk (Prediabetes),” and 6.5% or above is “Diabetes.” In other words, the report only flags you once you cross 5.7, everything below it earns a clean “Non diabetic” verdict.
Healthvizor reports against a tighter optimal band of 5.0–5.5%. That gap matters: a large meta-analysis published in The BMJ found that even within the 5.7–6.4% pre-disease range, the risk of cardiovascular disease and all-cause mortality is significantly elevated [1], and subclinical myocardial damage, kidney disease and peripheral artery disease are all already on the rise [2]. A reading of 5.6% earns a reassuring “Non diabetic” on the report, yet it sits above the optimal ceiling of 5.5%. It’s not a body in the clear; it’s one that has been quietly compensating for years.
2. Vitamin D: "sufficient" by lab, deficient by biology
Healthvizor sets the deficiency floor at 30 ng/mL and the optimal band higher still, at 40–60 ng/mL. Yet systematic reviews show 70–90% of apparently healthy Indians fall below even the conservative 20 ng/mL line many labs use, with women, urban dwellers and those with darker skin hit hardest [3]. Deficiency is so common that a simple “cleared the bar” verdict is almost meaningless; you have to know your specific number, not just whether it printed as normal. A value of 34 ng/mL is “sufficient” by the clinical floor and still short of optimal.
3. TSH: a single number that hides thyroid stress
A standard TSH reference range runs to about 4.78 mIU/L. But population studies suggest the optimal range is much narrower, 1.0–2.5 mIU/L, and that subclinical hypothyroidism (TSH 5–10 mIU/L with normal free T4) is associated with diastolic dysfunction, raised LDL and, in younger adults, a higher rate of coronary events [4]. A TSH of 4.2 isn’t reassuring just because it printed inside the reference range; it sits well above the optimal ceiling of 2.5.
4. ApoB: the cardiac number nobody is checking
Indian annual checkups still focus on total cholesterol and LDL. But a meta-analysis of 233,455 individuals published in Circulation: Cardiovascular Quality and Outcomes found that apolipoprotein B (ApoB), a count of every artery-clogging particle in your blood, predicted cardiovascular events more accurately than LDL or non-HDL cholesterol [5].
The INTERHEART study of 52 countries showed the ApoB/ApoA1 ratio carried a population-attributable risk of nearly 50% for heart attacks, the single largest modifiable risk factor on earth [6]. Most Indians, including those with "normal" lipid panels, have never had their ApoB measured.
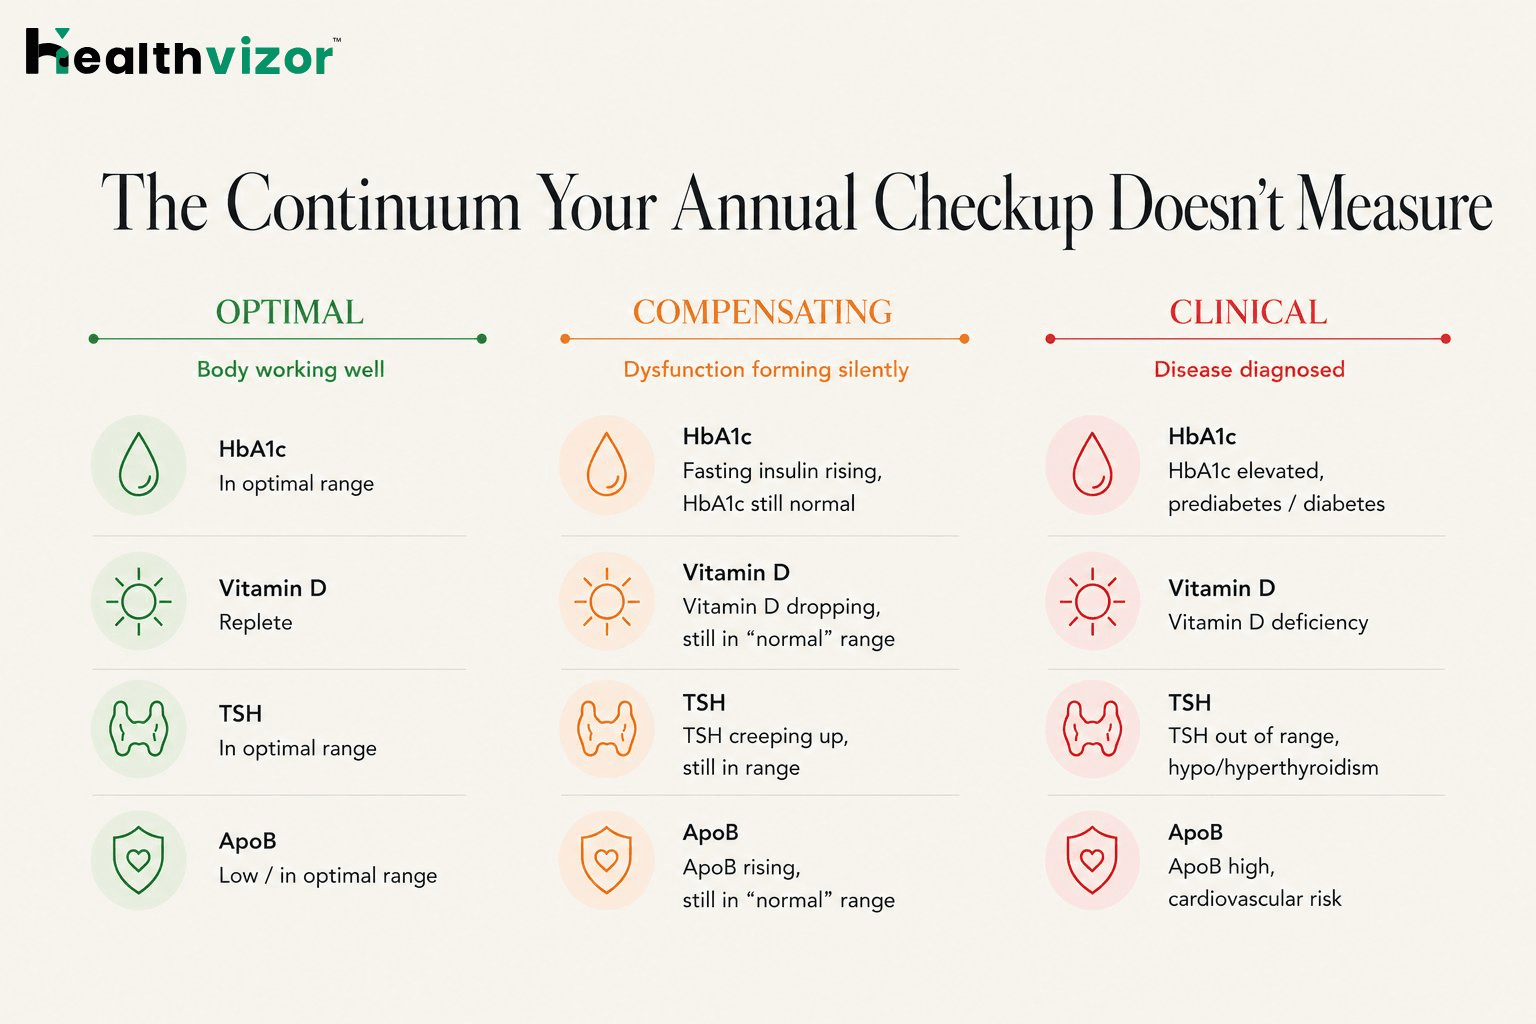
Step back and the pattern is clear. Annual checkups in India are designed to detect disease, like diabetes, hypertension, kidney failure, or frank heart disease. They're not designed to detect dysfunction, the slow, decade-long process by which a body shifts from optimal, to compensating, to symptomatic, to diagnosable.
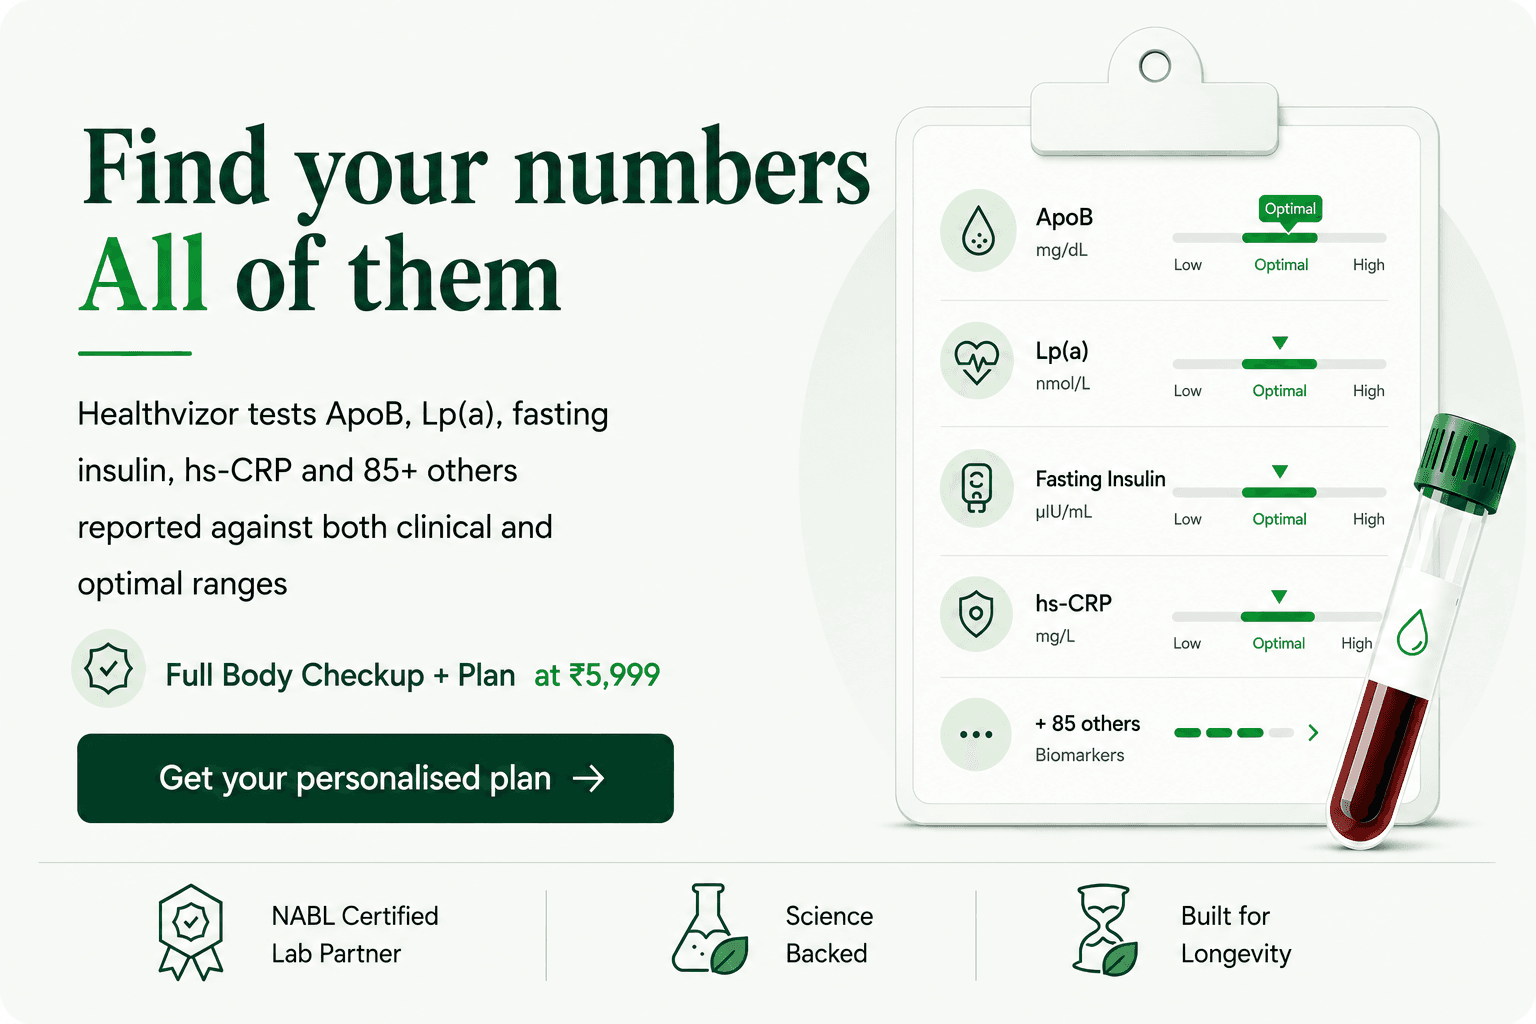
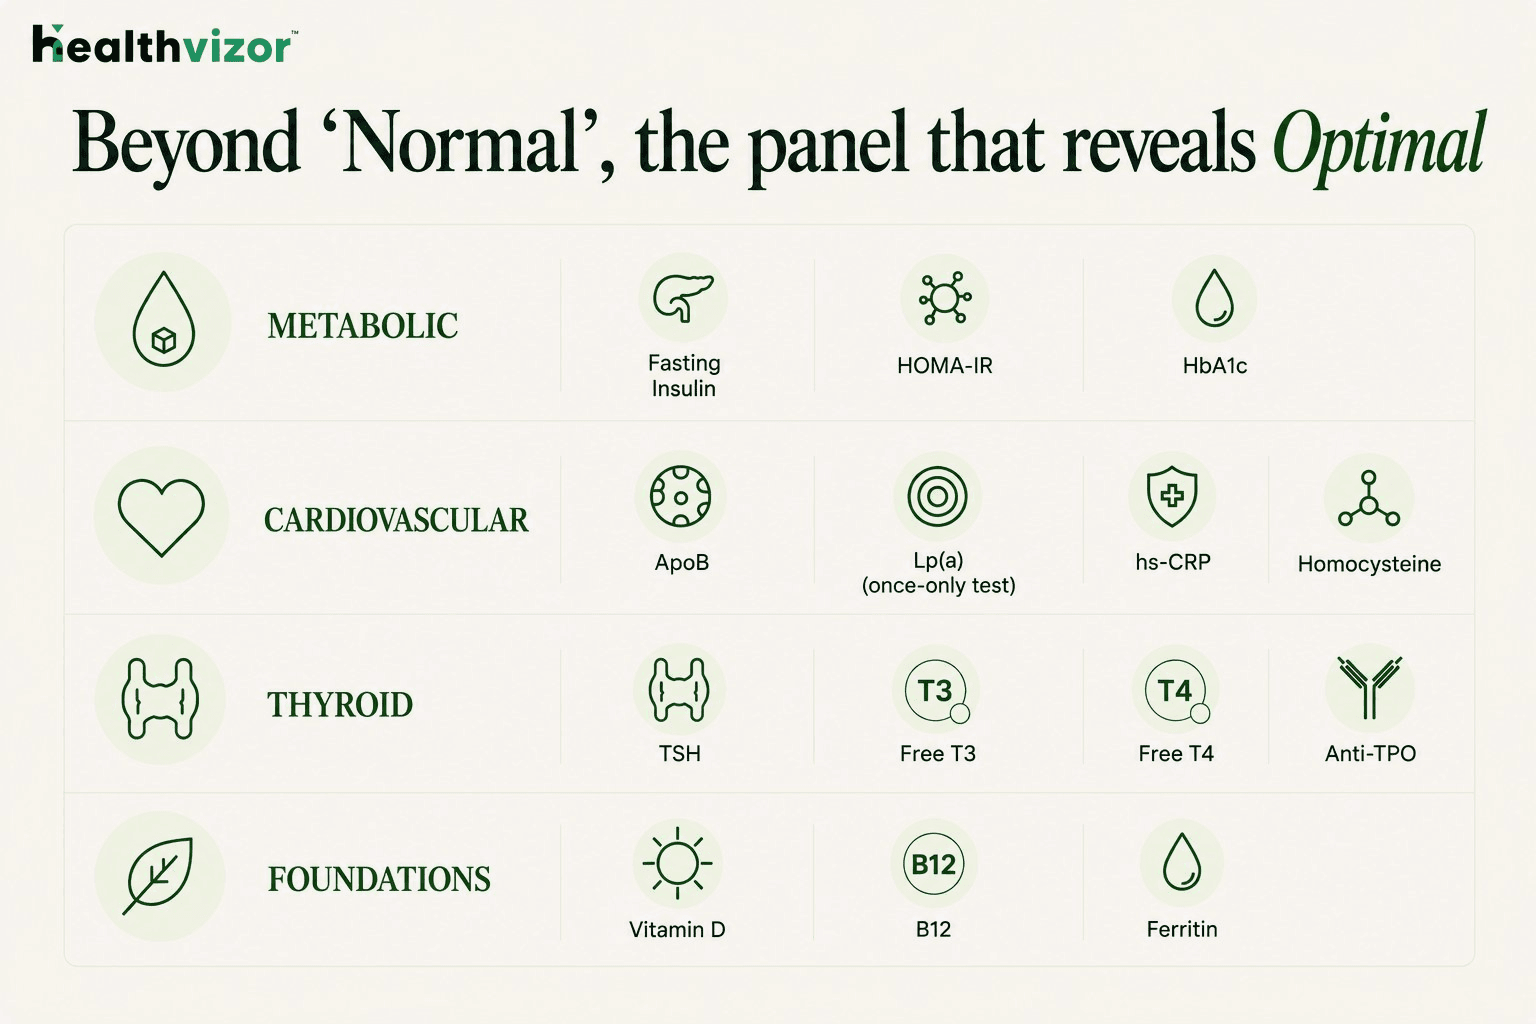
Most of the metrics that matter for that earlier window, such as fasting insulin, HOMA-IR, ApoB, Lp(a), hs-CRP, homocysteine, ferritin, free T3, vitamin D, and B12, are either not measured at all in standard panels, or are measured but flagged only at the disease threshold.
Take fasting insulin as an example. Insulin levels typically rise for years, sometimes a decade, before fasting glucose or HbA1c shifts. By the time HbA1c crosses into the prediabetic range, the body has been quietly compensating for visceral adiposity, poor sleep and a Western-style diet for far longer than the report admits. A normal fasting glucose alongside a fasting insulin of 14 µIU/mL is not normal metabolism; it's a pancreas working overtime to keep a glucose number looking acceptable.
The pattern repeats with hs-CRP, ApoB, ferritin, homocysteine and the full thyroid panel. Each biomarker has an optimal zone where the body works well, a compensating zone where dysfunction is forming silently, and a clinical zone where disease is finally diagnosed. Standard reports only show the boundary between the last two.
That's why so many people walk out of an annual checkup with a clean report and a body that disagrees.
What to do this week
Three questions to ask before your next checkup
Most preventive checkups in India are sold as packages. The package decides what gets tested; you decide whether to pay for it. That dynamic favours legacy panels that haven't been updated in a decade. Push back with three questions:
Does this panel include ApoB and Lp(a)? If not, ask whether they can be added, and what the marginal cost is. In most cities, the upgrade is small.
Will I get my actual HbA1c value, or only a flag? You want the number, ideally with a trend if you've tested before. The number is what you act on; the flag is just packaging.
Is fasting insulin or HOMA-IR included? Almost no standard package includes either. Both are genuinely informative for metabolic health and worth requesting explicitly.
If the answer to all three is no, the package is selling you reassurance, not insight.
How Healthvizor helps

We also track changes over time, so a single test today becomes a trend you can act on next quarter. That trend, more than any single number, is what separates a body that's quietly compensating from one that's actually optimised.
Because normal isn't the goal. Optimal is.